
Are you a KACE Systems Management Appliance user? 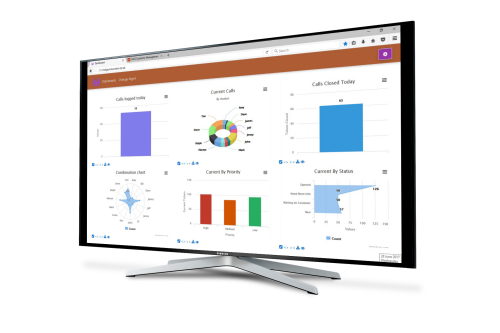
Do you use the Service Desk within your SMA to manage your IT Support?
Would you like to see your ticket data in Dashboard format, on a big screen, hand held or desktop device?
Then contact us to set up your new v3 DASHboard for your KACE SMA
How Does the DASHboard Work?
DASHboard is available as a local appliance solution or as a cloud solution if you prefer. Ticket data is passed via the standard ODBC connection from your KACE SMA to your DASHboard and is then reformatted so that the data is presented in views that make sense to your Service Desk and support resources, and then made available to your staff via your own customised URL.
What DASHboards are available?
The following DASHboards are available for customers
- • ServiceDesk Dashboard
- • SLA Dashboard
Coming Next...
- • Asset Management
- • Patch Management Dashboard
- • KPI / Executive Dashboard
What can I see on my Service Desk DASHboard?
Our latest DASHboard release is by far and away our most flexible release and allows you to carry out unlimited customisation to the look and feel of your DASHboard pages, Standard within this release comes the capability to:
- Select graphs from multiple queues on a single screen,
- Create your own layout of each page
- Time the rotation between screens for all created DASHboards
- Vary graph width and height
- Choose single rows or multiple row display
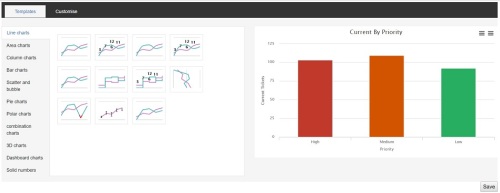
- Change the type of graphs (Bar Charts, Line graphs, pie charts, area graphs, column charts, single numbers and more)
- Customise graph titles and colours within every element
You have the choice of the following out of the box graphs to make up your DASHboards
- • Tickets Logged Today
- • Tickets Closed Today
- • Current Tickets
- • Combination of the above 3 graphs on a single graph (See Adjacent Image)
- • Tickets logged today by Technician
- • Tickets Closed today by Technician
- • Tickets Logged today by Priority
- • Current Tickets by Technician
- • Current Tickets by Priority
- • Current Tickets by Status
- • Daily summary Chart – Open Closed and Current
- • Weekly Summary Chart – Open, Closed, Current
- • Monthly Summary Chart – Open, Closed, Current
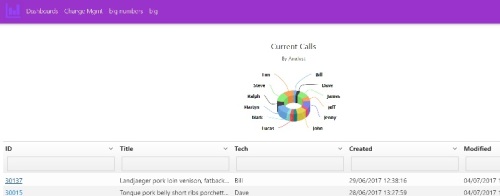 From within each graph you are able to view the underlying data that makes up the chart, print out the data or click on ticket references to link directly through to your KACE SMA.
If you require a graphic or Metric that is not currently available from the list, then we are also able to build custom graph components to add to your DASHboard.
Can I test the DASHboard before I join the Program?
We are happy to configure your DASHboard to run for a 30 Day Proof of Concept (POC) period, allowing you to see how you data looks real-time. If you require custom graphs for your DASHboard we will then make them available once you join the program
How Do I get started?
Contact us at the below email address to get more information or visit our website here
theindigoteam@indigomountain.co.uk

Comments