

Do you use the Service Desk within your K1000 to manage your IT Support?
Would you like to see your ticket data in Dashboard format, on a big screen, hand held or desktop device?
Then contact us to set up your new DASHboard for Dell KACE
How Does the DASHboard Work?
DASHboard is available primarily as a hosted solution, however a local solution is available for those customers not wishing to use cloud storage. Basic ticket, Asset and Inventory Data (varies depending on chosen DASHboards) is passed via our secure agent to your hosted DASHboard, reformatted so that the data is presented in views that make sense to your Service Desk resources, and made available to your staff via your own customised URL.
What DASHboards are available?
The following DASHboards are available for customers
• ServiceDesk Dashboard
• SLA Dashboard
• SLA Dashboard
• Inventory Dashboard
• Asset Management Dashboard
• Asset Management Dashboard
Coming Soon...
• Patch Management Dashboard
• Patch Management Dashboard
• KPI / Executive Dashboard
• Customer Satisfaction Dashboard
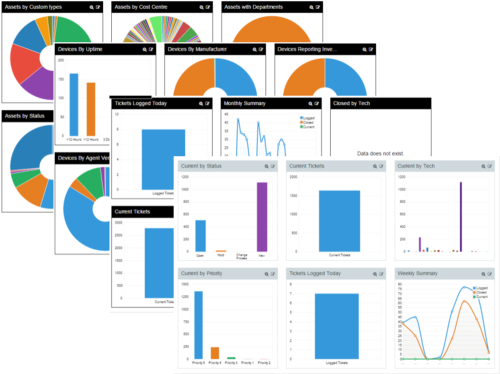
What can I see on my Service Desk DASHboard?
• Tickets Logged Today
• Tickets Closed Today
• Current Tickets
• Combination of the above 3 graphs on a single graph (See Adjacent Image)
• Tickets logged today by Technician
• Tickets Closed today by Technician
• Tickets Logged today by Priority
• Current Tickets by Technician
• Current Tickets by Priority
• Current Tickets by Status
• Weekly Summary Chart – Open, Closed, Current
• Monthly Summary Chart – Open, Closed, Current
What can I see on my Service Desk DASHboard? 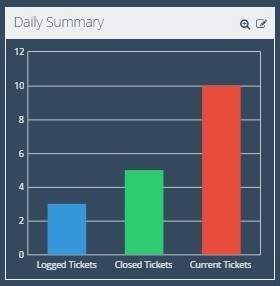
You are able to choose up to 6 Graphs per page, and you have the choice of the following graphs:
• Tickets Logged Today
• Tickets Closed Today
• Current Tickets
• Combination of the above 3 graphs on a single graph (See Adjacent Image)
• Tickets logged today by Technician
• Tickets Closed today by Technician
• Tickets Logged today by Priority
• Current Tickets by Technician
• Current Tickets by Priority
• Current Tickets by Status
• Weekly Summary Chart – Open, Closed, Current
• Monthly Summary Chart – Open, Closed, Current
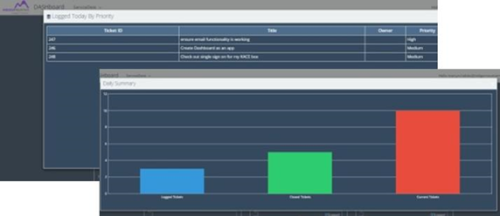
You are able to zoom in to show the graph large on the screen or alternatively you can view the data table behind the graphic
Can I customize my Dashboard?
When we create your DASHboard we are able to add your corporate logo to menu bar, you will also able to change the colours of all elements, for example Page colour, Dashboard Background, Dashboard Frame, Text colour etc so you can match your Dashboard to your corporate “look and feel.”
If you require a graphic or Metric that is not currently available from the list, then we are also able to build custom graph components to add to your DASHboard.
How much will the Live Service Cost?
We envisage a monthly subscription charge for hosted customers from as low as $99 per month for your initial DASHboard. For those customers requiring a local solution we will provide quotations on request..
How Do I get started?
Contact us at the below email address to get more information or visit our website here
theindigoteam@indigomountain.co.uk
If you require a graphic or Metric that is not currently available from the list, then we are also able to build custom graph components to add to your DASHboard.
Can I test the DASHboard before I join the Program?
We are happy to configure your DASHboard to run for a 45 Day Proof of Concet (POC) period, allowing you to see how you data looks real-time. If you require custom graphs for your DASHboard we will then make them available once you join the programHow much will the Live Service Cost?
We envisage a monthly subscription charge for hosted customers from as low as $99 per month for your initial DASHboard. For those customers requiring a local solution we will provide quotations on request..
How Do I get started?
Contact us at the below email address to get more information or visit our website here
theindigoteam@indigomountain.co.uk

Comments